Day 29. Switch Configuration Basics
CCENT 100-101 ICND1 Exam Topics
- Configure and verify initial device configuration
- Troubleshoot interface and cable issues (collisions, errors, duplex, speed)
Key Topics
Today we review Cisco IOS basics and the commands necessary to perform a basic initial configuration of a switch. We also review verification techniques such as the ping, traceroute, and show commands.
Accessing and Navigating the Cisco IOS
By now, you are very familiar with connecting to Cisco devices and configuring them using the command-line interface (CLI). Here we quickly review methods for accessing and navigating the CLI.
Connecting to Cisco Devices
You can access a device directly or from a remote location. Figure 29-1 shows the many ways you can connect to Cisco devices.
The two ways to configure Cisco devices are as follows:
- Console terminal: Use an RJ-45–to–RJ-45 rollover cable and a computer with the terminal communications software (such as HyperTerminal or Tera Term) to establish a direct connection. Optionally, you can connect a mini-USB cable to the mini-USB console port, if available.
- Remote terminal: Use an external modem connected to the auxiliary port (routers only) to remotely configure the device.
After it is configured, you can access the device using three additional methods:
- Establish a terminal (vty) session using Telnet.
- Configure the device through the current connection (console or auxiliary), or download a previously written startup config file from a Trivial File Transfer Protocol (TFTP) server on the network.
- Download a configuration file using a network management software application such as CiscoWorks.
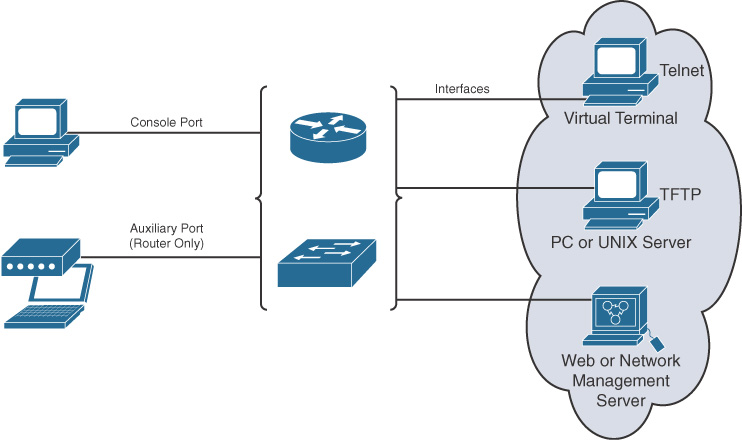
Figure 29-1 Sources for Cisco Device Configuration
CLI EXEC Sessions
Cisco IOS separates the EXEC session into two basic access levels:
- User EXEC mode: Access to only a limited number of basic monitoring and troubleshooting commands, such as show and ping
- Privileged EXEC mode: Full access to all device commands, including configuration and management
Using the Help Facility
Cisco IOS has extensive command-line input help facilities, including context-sensitive help. The following summarizes the two types of help available:
- Word help: Enter a character sequence of an incomplete command immediately followed by a question mark (sh?) to get a list of available commands that start with the character sequence.
- Command syntax help: Enter the ? command to get command syntax help to see all the available arguments to complete a command (show ?). Cisco IOS then displays a list of available arguments.
As part of the help facility, Cisco IOS displays console error messages when incorrect command syntax is entered. Table 29-1 shows sample error messages, what they mean, and how to get help.
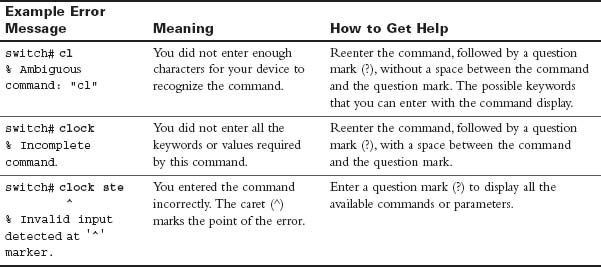
Table 29-1 Console Error Messages
CLI Navigation and Editing Shortcuts
Table 29-2 summarizes the shortcuts for navigating and editing commands in the CLI. Although not specifically tested on the CCNA exam, these shortcuts can save you time when using the simulator during the exam.
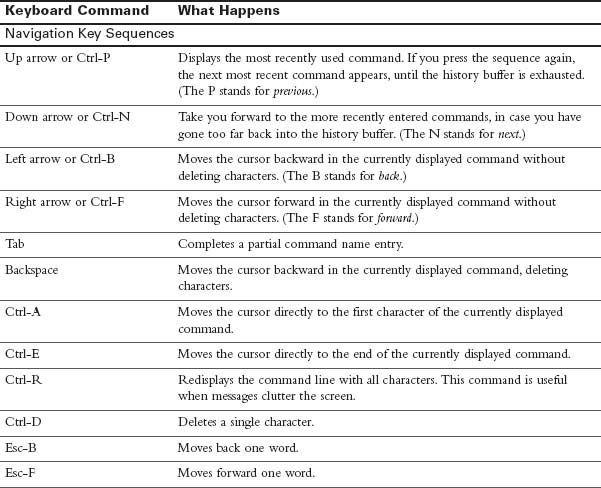
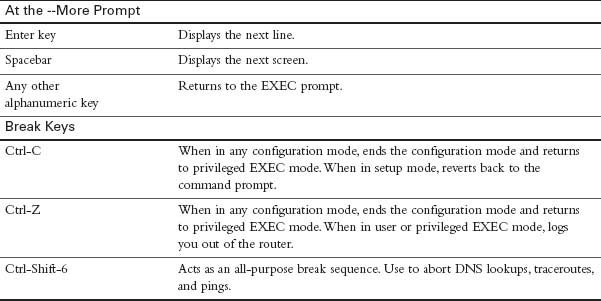
Table 29-2 Hot Keys and Shortcuts
Command History
By default, the Cisco IOS stores the last ten commands you entered in a history buffer. This gives you a quick way to move backward and forward in the history of commands, choose one, and then edit it before reissuing the command. To view or configure the command history buffer, use the commands in Table 29-3. Although this table shows the switch prompt, these commands are also appropriate for a router.
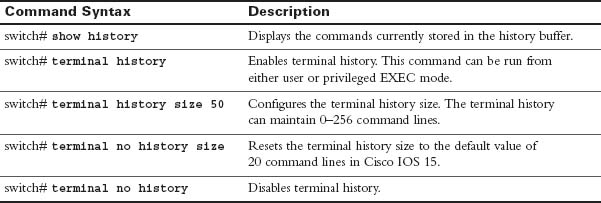
Table 29-3 Command History Buffer Commands
IOS Examination Commands
To verify and troubleshoot network operation, you use show commands. Figure 29-2 delineates the different show commands, as follows:
- Commands applicable to Cisco IOS (stored in RAM)
- Commands that apply to the backup configuration file stored in NVRAM
- Commands that apply to Flash or specific interfaces
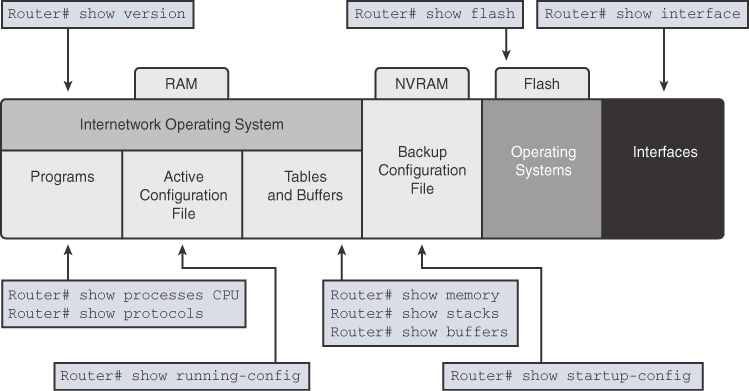
Figure 29-2 Typical show Commands and the Information Provided
Subconfiguration Modes
To enter global configuration mode, enter the configure terminal command. From global configuration mode, Cisco IOS provides a multitude of subconfiguration modes. Table 29-4 summarizes the most common subconfiguration modes pertinent to the CCNA exam.
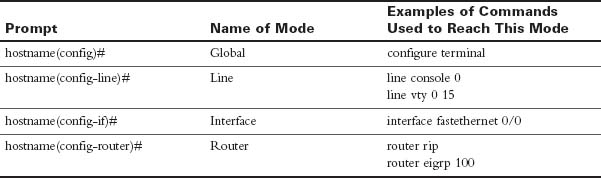
Table 29-4 Cisco Device Subconfiguration Modes
 Activity: Identify the Cisco IOS Navigation Feature
Basic Switch Configuration Commands
Table 29-5 reviews basic switch configuration commands.
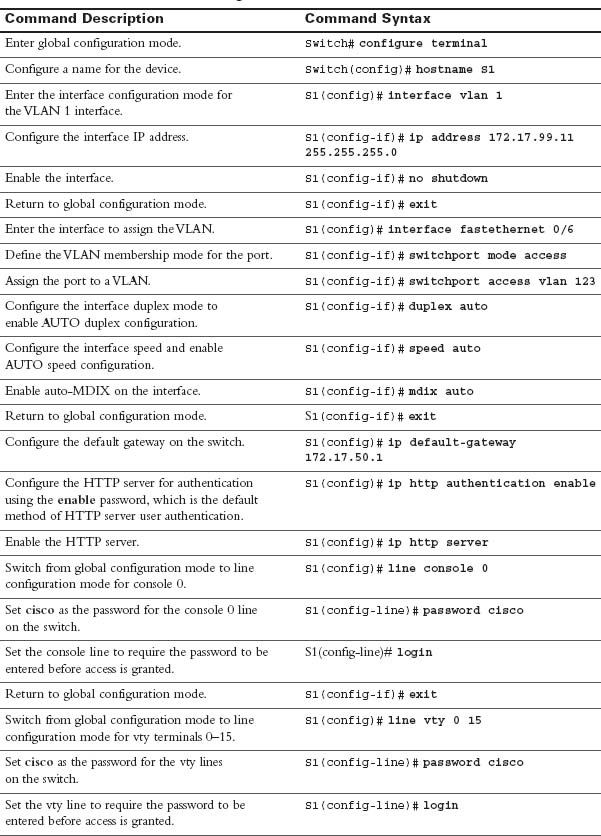
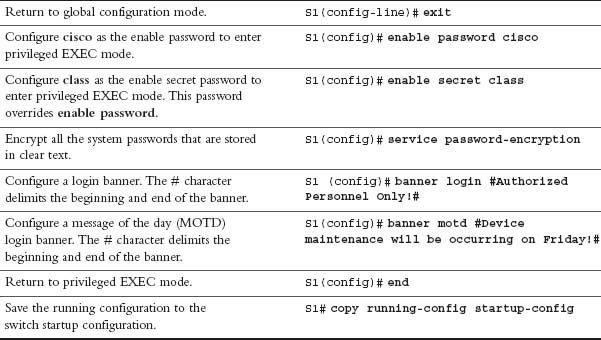
Table 29-5 Basic Switch Configuration Commands
To configure multiple ports with the same command, use the interface range command. For example, to configure ports 6–10 as access ports belonging to VLAN 10, you enter the following:
Switch(config)# interface range FastEthernet 0/6 – 10
Switch(config-if-range)# switchport mode access
Switch(config-if-range)# switchport access vlan 10
Packet Tracer Activity: Basic Switch Configuration
You must have Packet Tracer software to run this activity. See Introduction for details.
![]()
Half-Duplex, Full-Duplex, and Port Speed
Half-duplex communication is unidirectional data flow in which a device can either send or receive on an Ethernet LAN, but not both at the same time. Today’s LAN networking devices and end device network interface cards (NIC) operate at full duplex as long as the device is connected to another device capable of full-duplex communication. Full-duplex communication increases the effective bandwidth by allowing both ends of a connection to transmit and receive data simultaneously; this is known as bidirectional. This microsegmented LAN is collision free. Gigabit Ethernet and 10 Gbps NICs require full-duplex connections to operate. Port speed is simply the bandwidth rating of the port. The most common speeds today are 100 Mbps, 1 Gbps, and 10 Gbps.
Although the default duplex and speed setting for Cisco Catalyst 2960 and 3560 switches is auto, you can manually configure the speed and duplex commands.
Note:
Setting the duplex mode and speed of switch ports can cause issues if one end is mismatched or set to autonegotiation. In addition, all fiber-optic ports, such as 100BASE-FX ports, operate only at one preset speed and are always full duplex.
Automatic Medium-Dependent Interface Crossover (auto-MDIX)
In the past, switch-to-switch or switch-to-router connections required using different Ethernet cables (crossover or straight-through). Using the automatic medium-dependent interface crossover (auto-MDIX) feature on an interface eliminates this problem. When auto-MDIX is enabled, the interface automatically detects the required cable connection type (straight-through or crossover) and configures the connection appropriately.
The auto-MDIX feature is enabled by default on Catalyst 2960 and Catalyst 3560 switches. The Gigabit Ethernet standard requires auto-MDIX, so any 1000 Mbps port has this capability. When using auto-MDIX on an interface, the interface speed and duplex must be set to auto so that the feature operates correctly.
Verifying Network Connectivity
Using and interpreting the output of various testing tools is often the first step in isolating the cause of a network connectivity issue. The ping command can systematically test connectivity in the following manner:
- Can an end device ping itself?
- Can an end device ping its default gateway?
- Can an end device ping the destination?
By using the ping command in this ordered sequence, you can isolate problems faster. If local connectivity is not an issue—in other words, the end device can successfully ping its default gateway—using the traceroute utility can help isolate the point in the path from source to destination where the traffic stops.
As a first step in the testing sequence, verify the operation of the TCP/IP stack on the local host by pinging the loopback address, 127.0.0.1, as Example 29-1 demonstrates.
Example 29-1 Testing the TCP/IP Stack on a Windows PC
C:\> ping 127.0.0.1


 Pinging 127.0.0.1 with 32 bytes of data:


 Reply from 127.0.0.1: bytes=32 time<1ms TTL=64

 Reply from 127.0.0.1: bytes=32 time<1ms TTL=64

 Reply from 127.0.0.1: bytes=32 time<1ms TTL=64

 Reply from 127.0.0.1: bytes=32 time<1ms TTL=64


 Ping statistics for 127.0.0.1:

     Packets: Sent = 4, Received = 4, Lost = 0 (0% loss),

 Approximate round trip times in milli-seconds:

     Minimum = 0ms, Maximum = 0ms, Average = 0ms
This test should succeed regardless of whether the host is connected to the network, so a failure indicates a software or hardware problem on the host itself. Either the network interface is not operating properly or support for the TCP/IP stack has been inadvertently removed from the operating system.
Next, verify connectivity to the default gateway. Determine the default gateway address using ipconfig and then attempt to ping it, as in Example 29-2.
Example 29-2 Testing Connectivity to the Default Gateway on a Windows PC
C:\> ipconfig


 Windows IP Configuration


 Ethernet adapter Local Area Connection:


         Connection-specific DNS Suffix . : cisco.com

         IP Address. . . . . . . . . . . . : 192.168.1.25

         Subnet Mask . . . . . . . . . . . : 255.255.255.0

         Default Gateway . . . . . . . . . : 192.168.1.1


 C:\> ping 192.168.1.1


 Pinging 192.168.1.1 with 32 bytes of data:


 Reply from 192.168.1.1: bytes=32 time=162ms TTL=255

 Reply from 192.168.1.1: bytes=32 time=69ms TTL=255

 Reply from 192.168.1.1: bytes=32 time=82ms TTL=255

 Reply from 192.168.1.1: bytes=32 time=72ms TTL=255


 Ping statistics for 192.168.1.1:

      Packets: Sent = 4, Received = 4, Lost = 0 (0% loss),

 Approximate round trip times in milli-seconds:

      Minimum = 69ms, Maximum = 162ms, Average = 96ms
Failure here can indicate several problems, each of which must be checked in a systematic sequence. One possible order might be the following:
1. Is the cabling from the PC to the switch correct? Are link lights lit?
2. Is the configuration on the PC correct according to the logical map of the network?
3. Are the affected interfaces on the switch the cause of the problem? Is there a duplex, speed, or auto-MDIX mismatch? Are there VLAN misconfigurations?
4. Is the cabling from the switch to the router correct? Are link lights lit?
5. Is the configuration on the router interface correct according to the logical map of the network? Is the interface active?
Finally, verify connectivity to the destination by pinging it. Assume that you are trying to reach a server at 192.168.3.100. Example 29-3 shows a successful ping test to the destination.
Example 29-3 Testing Connectivity to the Destination on a Windows PC
PC> ping 192.168.3.100


 Pinging 192.168.3.100 with 32 bytes of data:


 Reply from 192.168.3.100: bytes=32 time=200ms TTL=126

 Reply from 192.168.3.100: bytes=32 time=185ms TTL=126

 Reply from 192.168.3.100: bytes=32 time=186ms TTL=126

 Reply from 192.168.3.100: bytes=32 time=200ms TTL=126


 Ping statistics for 192.168.3.100:

      Packets: Sent = 4, Received = 4, Lost = 0 (0% loss),

 Approximate round trip times in milli-seconds:

      Minimum = 185ms, Maximum = 200ms, Average = 192ms
Failure here indicates a failure in the path beyond the default gateway interface because you already successfully tested connectivity to the default gateway. From a Windows PC, the best tool to use to find the break in the path is the tracert command (see Example 29-4).
Note:
Both Mac OS X and Linux use the traceroute command.
Example 29-4 Tracing the Route from a Windows PC
C:\> tracert 192.168.3.100


 Tracing route to 192.168.3.100 over a maximum of 30 hops:


   1   97 ms     75 ms     72 ms     192.168.1.1

   2   104 ms    119 ms    117 ms    192.168.2.2

   3   *          *         *         Request timed out.

   4   *          *         *         Request timed out.

   5   *          *         *         Request timed out.

   6   ^C

C:\>
Note:
Failure at hops 3, 4, and 5 in Example 29-4 could indicate that these routers are configured to not send ICMP messages back to the source.
The last successful hop on the way to the destination was 192.168.2.2. If you have administrator rights to 192.168.2.2, you can continue your research by remotely accessing the command line on 192.168.2.2 and investigating why traffic will not go any further. Additionally, other devices between 192.168.2.2 and 192.168.3.100 could be the source of the problem. The point is, you want to use your ping and tracert tests, as well as your network documentation, to proceed in a logical sequence from source to destination.
Regardless of how simple or complex your network is, using ping and tracert from the source to the destination is a simple yet powerful way to systematically verify end-to-end connectivity, as well as locate breaks in a path from one source to one destination.
Troubleshoot Interface and Cable Issues
The physical layer is often the reason a network issue exists—power outage, disconnected cable, power-cycled devices, hardware failures, and so on. This section looks at some troubleshooting tools, in addition to the approach of actually walking over to the wiring closet or network device and “physically” checking layer 1.
Media Issues
Besides failing hardware, common physical layer issues occur with media. Consider a few examples:
- New equipment is installed that introduces electromagnetic interference (EMI) sources into the environment.
- Cable runs too close to powerful motors, such as an elevator.
- Poor cable management puts a strain on some RJ-45 connectors, causing one or more wires to break.
- New applications change traffic patterns.
- When new equipment is connected to a switch, the connection operates in half-duplex mode or a duplex mismatch occurs, which can lead to an excessive number of collisions.
Figure 29-3 shows an excellent troubleshooting flowchart that you can use in troubleshooting switch media issues.
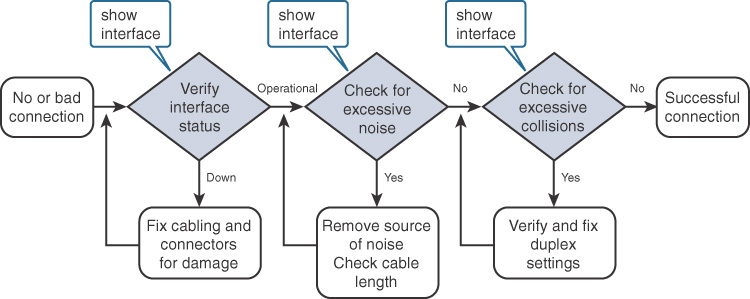
Figure 29-3 Troubleshooting Switch Medial Issues
Next, take look at the output from the show interface and show interface status commands.
Interface Status and the Switch Configuration
Because today we are focusing on switch troubleshooting, we look at the show commands that help in troubleshooting the basic configuration.
Interface Status Codes
In general, interfaces are either “up” or “down.” However, when an interface is “down” and you don’t know why, the code in the show interfaces command provides more information to help you determine the reason. Table 29-6 lists the code combinations and some possible causes for the status indicated.
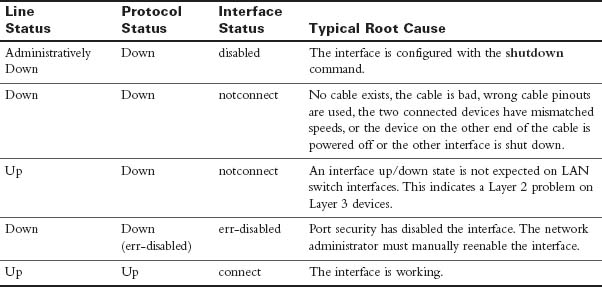
Table 29-6 LAN Switch Interface Status Codes
Duplex and Speed Mismatches
One of the more common problems is issues with speed and/or duplex mismatches. On switches and routers, the speed {10 | 100 | 1000} interface subcommand and the duplex {half | full} interface subcommand set these values. Note that configuring both speed and duplex on a switch interface disables the IEEE-standard autonegotiation process on that interface.
The show interfaces status and show interfaces commands list both the speed and duplex settings on an interface, as Example 29-5 shows.
Example 29-5 Commands to Verify Speed and Duplex Settings
S1# show interface status

 Port      Name         Status      Vlan      Duplex   Speed Type

 Fa0/1                  connected   trunk     full     100 10/100BaseTX

 Fa0/2                  connected   1         half     100 10/100BaseTX

 Fa0/3                  connected   1         a-full   a-100 10/100BaseTX

 Fa0/4                  disabled    1         auto     auto 10/100BaseTX

 Fa0/5                  disabled    1         auto     auto 10/100BaseTX

 Fa0/6                  notconnect  1         auto     auto 10/100BaseTX
!Remaining output omitted

 S1# show interface fa0/3

 FastEthernet0/1 is up, line protocol is up (connected)

   Hardware is Fast Ethernet, address is 001b.5302.4e81 (bia 001b.5302.4e81)

   MTU 1500 bytes, BW 100000 Kbit, DLY 100 usec,

     reliability 255/255, txload 1/255, rxload 1/255

   Encapsulation ARPA, loopback not set

   Keepalive set (10 sec)

   Full-duplex, 100 Mb/s, media type is 10/100BaseTX

   input flow-control is off, output flow-control is unsupported

   ARP type: ARPA, ARP Timeout 04:00:00

   Last input never, output 00:00:00, output hang never

   Last clearing of "show interface" counters never

   Input queue: 0/75/0/0 (size/max/drops/flushes); Total output drops: 0

   Queueing strategy: fifo

   Output queue: 0/40 (size/max)

   5 minute input rate 1000 bits/sec, 1 packets/sec

   5 minute output rate 0 bits/sec, 0 packets/sec

     2745 packets input, 330885 bytes, 0 no buffer

     Received 1386 broadcasts (0 multicast)

     0 runts, 0 giants, 0 throttles

     0 input errors, 0 CRC, 0 frame, 0 overrun, 0 ignored

     0 watchdog, 425 multicast, 0 pause input

     0 input packets with dribble condition detected

     56989 packets output, 4125809 bytes, 0 underruns

     0 output errors, 0 collisions, 1 interface resets

     0 babbles, 0 late collision, 0 deferred

     0 lost carrier, 0 no carrier, 0 PAUSE output

     0 output buffer failures, 0 output buffers swapped out
Notice that both commands show the duplex and speed settings of the interface. However, the show interface status command is preferred for troubleshooting duplex or speed mismatches because it shows exactly how the switch determined the duplex and speed of the interface. In the duplex column, a-full means the switch autonegotiated full duplex. The setting full or half means that the switch was configured at that duplex setting. Autonegotiation has been disabled. In the speed column, a-100 means the switch autonegotiated 100 Mbps as the speed. The setting 10 or 100 means that the switch was configured at that speed setting.
Finding a duplex mismatch can be much more difficult than finding a speed mismatch because if the duplex settings do not match on the ends of an Ethernet segment, the switch interface will still be in a connect (up/up) state. In this case, the interface works, but the network might work poorly, with hosts experiencing poor performance and intermittent communication problems. To identify duplex mismatch problems, check the duplex setting on each end of the link and watch for incrementing collision and late collision counters, as highlighted in the output at the end of Example 29-5.
Common Layer 1 Problems On “Up” Interfaces
When a switch interface is “up,” it does not necessarily mean that the interface is operating in an optimal state. For this reason, Cisco IOS tracks certain counters to help identify problems that can occur even though the interface is in a connect state. The output in Example 29-5 highlights these counters. Table 29-7 summarizes three general types of Layer 1 interface problems that can occur while an interface is in the “up,” connected state.
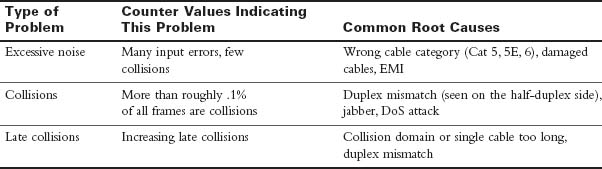
Table 29-7 Common LAN Layer 1 Problem Indicators
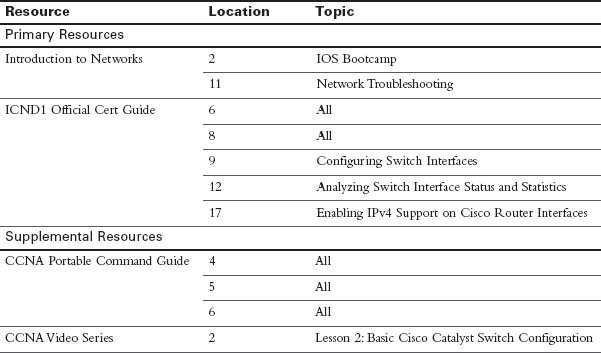
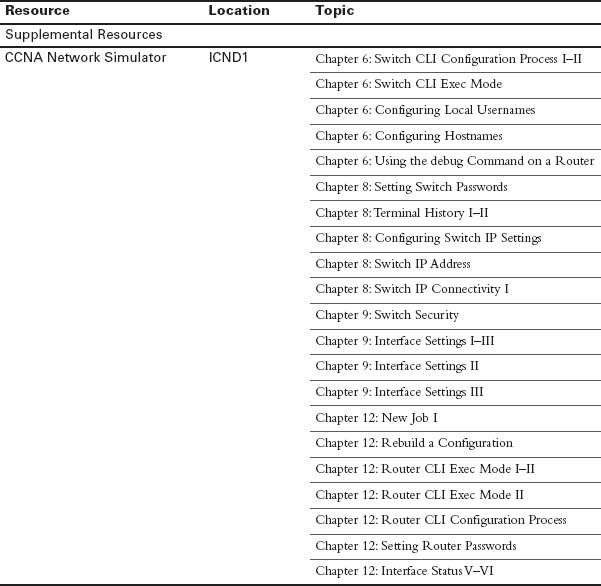
Study Resources
For today’s exam topics, refer to the following resources for more study.
 Check Your Understanding