
Note
In addition to console.log, you can use console.error(), console.assert(), and a variety of other statements to log information to the JavaScript console. For more information about how to use the Firebug console log, see
A major challenge when writing JavaScript and jQuery applications is finding and fixing problems in your scripts. Simple syntax problems or invalid values can cause a lot of frustration and wasted time. For that reason, some excellent tools have been created to help you quickly and easily find problems in your scripts. In this hour, you learn some of the basics of debugging JavaScript via Firebug in Mozilla. Although the developer consoles in other browsers are a bit different, most of the principles are the same. Also, don’t be alarmed if you don’t recognize the code element in the examples. They’ll be covered in upcoming hours, but you should be able to debug before you jump into coding heavily.
One of the first debugging tools that you will want to become familiar with is the JavaScript console. The console is your interface to output from JavaScript scripts. Errors and log messages will be displayed as they occur in the JavaScript console.
For example, when an error in the script results in the browser not being able to parse it, the error will be displayed in the console. In addition to errors, by using the console.log statement, you can also add your own debug statements to be displayed in the JavaScript console.
The JavaScript console is a fairly basic and yet powerful tool. The console has two parts: the controls and the list of log entries. Figure 2.1 shows the Firebug JavaScript console.
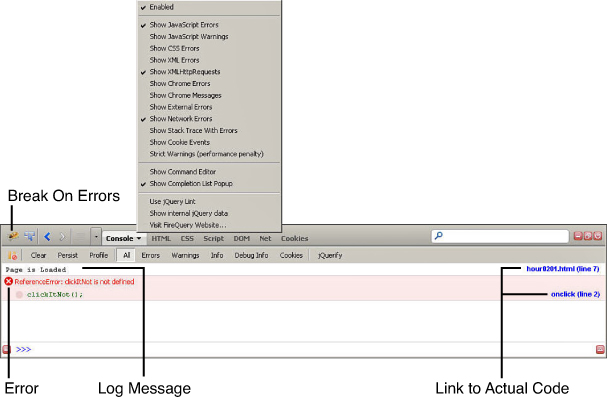
FIGURE 2.1 The JavaScript console in Firebug displays log messages and errors.
Notice the menu displayed when you click the down arrow in the Console tab. From that menu you can enable the console, as well as select which types of errors and log messages to include in the message list.
The console also provides a toolbar with several options. The options in the console toolbar are toggled by clicking them. The following list describes each of the options in the control bar:
Notice that in the messages portion in Figure 2.1, there are two types of messages. One is a log statement, and the second is an error. Both show the line number to the right. If you click the line number, you go directly to the code.
Notice in the error message, the top portion of text refers to the error that occurred and the bottom shows the actual JavaScript line. This is useful when debugging because you can often see the problem by looking at the error and the single line of code.
LISTING 2.1 A Very Simple HTML Document with JavaScript Errors
The code in Listing 2.1 is supposed to display the message Page Is Loaded in the console after the page has been loaded in the browser. Another message, User Clicked, is displayed each time the user clicks the Click Me text in the browser. The problem is that the script has several bugs.
With the file now in place, use the following steps to debug the errors using the JavaScript console:
1. Open Firefox and click the Firebug icon.
2. Click the Console tab in Firebug to bring up the JavaScript console shown in Figure 2.2.
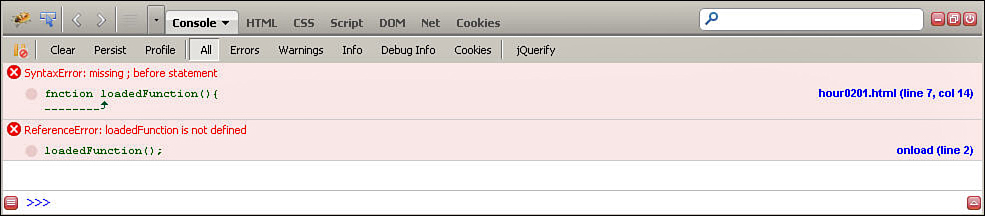
FIGURE 2.2 The JavaScript console showing two errors that occurred during the page load.
3. Open the following URL in Firefox to load the newly created web page:
http://localhost/code/hour02/hour0201.html
4. Notice the errors displayed in the console, as shown in Figure 2.2. The first error shows that missing “;” in the definition for loadedFunction(). The second error shows that loadedFunction is not defined. Taking these two errors together indicates that a problem exists with the definition for loadedFunction(). Looking at the failed definition statement, you can see that function is misspelled as fnction.
5. In Aptana, change the word fnction in line 6 to function.
6. Go back to Firefox and refresh the web page. Now in the console you should see Page Is Loaded, the text that is logged in the loadedFunction() function, but no errors.
7. Click the Click Me text. An error is added to the console, as shown in Figure 2.3. The error states that clickItNot is not defined. When you look at the HTML file and search for clickItNot, you can see on line 16 that an onclick event is linked to clickItNot(), but that the JavaScript function is named clickIt().
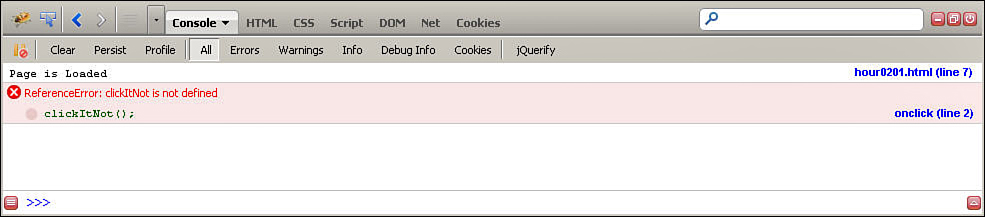
FIGURE 2.3 The JavaScript console showing one successful log message and one error.
8. In Aptana, change clickItNot in line 15 to clickIt and save the file.
9. Reload the web pages.
10. Click the Click Me Text again. Figure 2.4 shows that both log statements are now displayed correctly and there are no errors. The page has been successfully debugged.
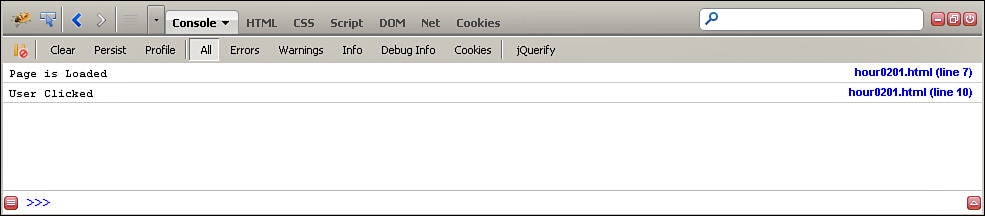
FIGURE 2.4 The JavaScript console showing two successful log messages and no errors.
Debugging HTML elements can be a big challenge at times. Simple syntax errors can lead to major problems for the browser when it’s trying to render an HTML document. In addition, HTML elements have property values that are not rendered to the screen but that will affect the behavior of the web page.
The HTML Inspector and the DOM editor help you find and fix problems in your HTML code. The following sections take you through some simple examples of using those tools.
The HTML Inspector enables you to view each of the HTML elements that have been parsed by the browser. This gives you a view of the HTML from the browser’s perspective, which in the case of syntax errors is usually different from the one that was intended, making it more obvious where syntax errors are.
Figure 2.5 shows an example of the Firebug HTML Inspector. With the HTML Inspector, some very useful features are available to you as described next:
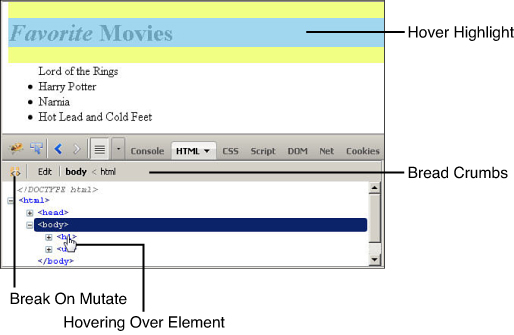
FIGURE 2.5 The HTML Inspector page in Firebug.
Note
When an element is hovered over in the DOM tree, the element is highlighted on the web page. The hover highlight is color coded, with light blue being the contents, purple being the padding, and yellow being the margin for the HTML element.
<h1> element hovered, the heading is highlighted in the web page.<html> node down to the one that is currently selected in the tree or edit view. This makes it easy to navigate around, especially in the edit view.Video 2.1—Try it Yourself: Debugging HTML Using the HTML Inspector
LISTING 2.2 A Very Simple HTML Document with Some HTML Syntax Errors Illustrated in Figure 2.6

FIGURE 2.6 This web page has two problems: Only the word “Favorite” should be in italic, and there is no bullet point on the first list item.
Follow along with these steps to find and fix the HTML syntax problems using the HTML Inspector:
1. Add the code in Listing 2.2 to a new file hour0202.html in the hour02 folder of your project and save the document. You should be familiar with this process by now.
2. Open Firefox and click the Firebug icon to enable Firebug.
3. Open the following URL in Firefox; the web page should look like Figure 2.6.
http://localhost/code/hour02/hour0202.html
4. Click the HTML tab in Firebug and expand the <html>, then <body>, and then <i> tags, as shown in Figure 2.7. Notice that the only element under the <i> tag is a second <i> tag. That isn’t right, so go back to Aptana and look at the <i> tags on line 7 in the HTML. Notice that the / is missing from the closing <i> tag.
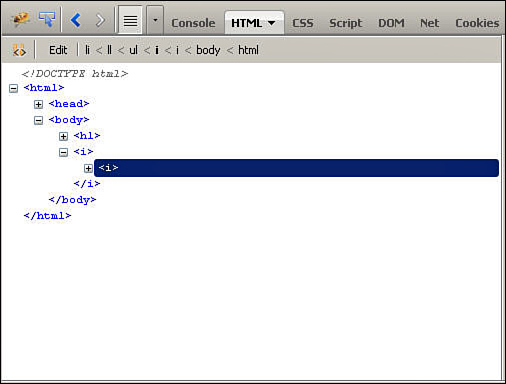
FIGURE 2.7 This HTML Inspector shows a second <i> in the DOM.
5. Change the second <i> tag to a closing tag </i> and save the document.
6. Refresh the document in the browser. Notice that the word “Favorite” is now in italic, as it should be, but the bullet point is still missing, as shown in Figure 2.8.
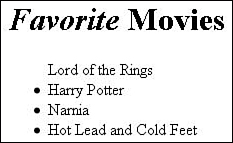
FIGURE 2.8 This web page now has only one problem—no bullet point on the first list item.
7. Go back to the HTML Inspector and expand the <html>, then <body>, then <ul>, then <ll>, as shown in Figure 2.9. Instead of a set of four <li> elements under the <ul> element, there is an <ll> element with the <li> elements underneath. We haven’t covered the HTML tags yet, but if you are familiar with HTML lists, you will recognize that ll is not a valid HTML tag. It should be <li>.
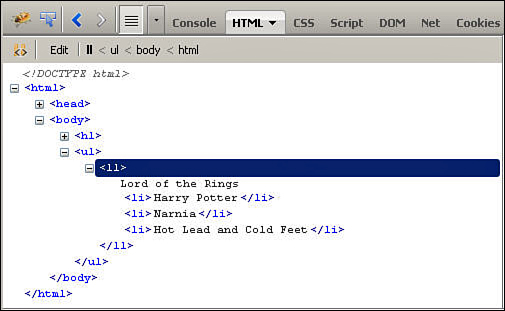
FIGURE 2.9 Viewing the DOM reveals that the browser sees an <ll> tag under the <ul> tag, not a set of <li> tags.
8. Go back to Aptana and change the <ll> tag in line 9 to <li> and save the page.
9. Reload the web page in the browser. It is now displayed properly, as shown in Figure 2.10.
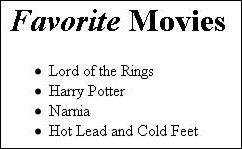
FIGURE 2.10 The properly formatted web page.
Another important tool when debugging HTML is the DOM inspector. The DOM inspector is extremely powerful. It allows you to view the attributes, properties, functions, children, parents, and everything else about each HTML element in the DOM. The information is displayed in tree form so that you can expand and collapse groups.
The DOM inspector can be found in two places: either by clicking the DOM tab in Firebug or, when you are inspecting HTML, you can click the DOM tab in the HTML Inspector.
Figure 2.11 shows the main DOM inspector. From the main DOM inspector, you have access to a variety of information about the browser environment. For example, in Figure 2.11, the screen attribute of the window object is expanded, revealing the values of the available and actual dimensions of the browser window.
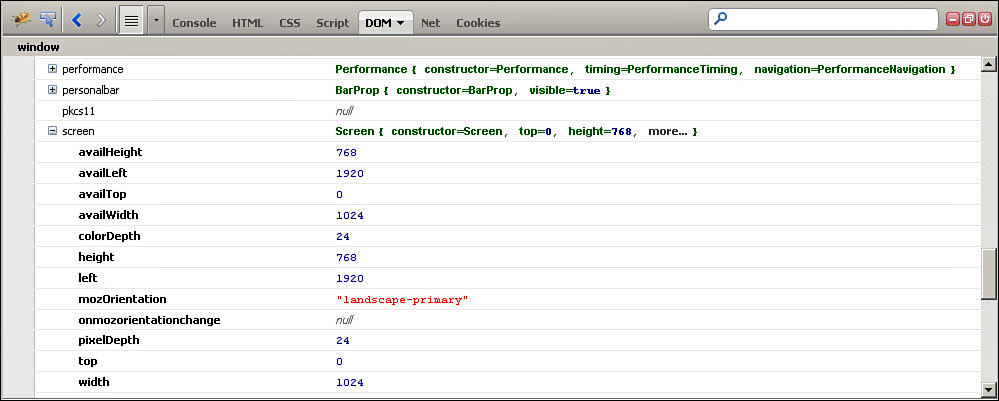
FIGURE 2.11 The main DOM inspector tab in Firebug.
Typically, it’s preferable to use the DOM inspector from the HTML Inspector, as shown in Figure 2.12. When you use the DOM tab in the HTML Inspector, you see only the DOM for that HTML element, which reduces the amount of information that is displayed. It also makes it easy to quickly change attribute values of the HTML element directly in the browser, which makes debugging and developing much easier.
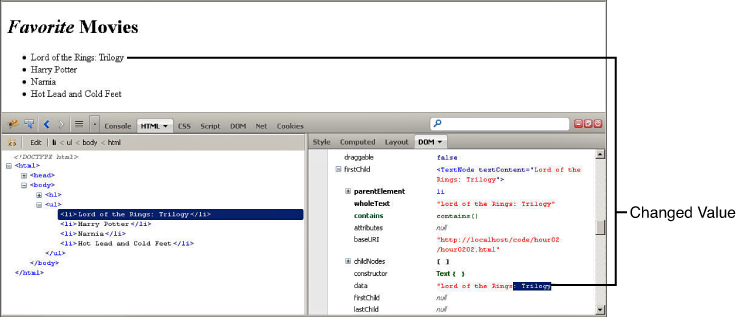
FIGURE 2.12 Editing HTML elements inside the DOM inspector.
As part of debugging your dynamic web pages, you also need to be aware of how to debug CSS issues because a lot of the dynamics of web pages deal with modifying CSS layout in the JavaScript.
If your JavaScript or jQuery scripts modify the CSS layout of DOM elements, looking at the code in the web browser will not do you any good. You need to be able to see what CSS the browser has applied to the element. To do this, you need to use a combination of the CSS inspector as well as the layout inspector and style inspector inside the HTML Inspector.
The CSS inspector, shown in Figure 2.13, provides access to all the CSS scripts loaded in the web page. There are two drop-down menus at the top of the CSS inspector. The menu on the left allows you to toggle between the following options:
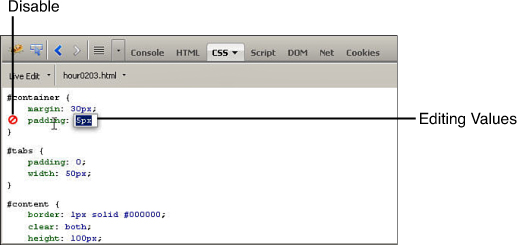
FIGURE 2.13 Editing CSS properties inside the CSS inspector.
The menu on the left provides a list of all the files containing CSS that have been loaded. This enables you to select which CSS document you would like to view and edit.
From the CSS inspector, you also have the capability to edit the CSS. Figure 2.13 shows the editing in process. Notice the disable icon. When you click this icon, that CSS property will be disabled, and the icon will go from red to gray. You can also directly edit the value of the CSS property, as shown in Figure 2.13.
In addition to editing the entire CSS file, you can view and edit the CSS properties for specific elements from the HTML Inspector. Figure 2.14 shows the Style tab in the HTML Inspector. From the Style inspector, you can view and modify the property values for a specific element.
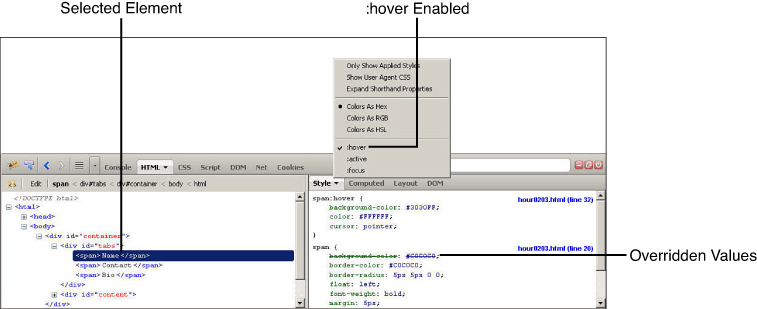
FIGURE 2.14 Editing CSS properties inside the Style inspector inside the HTML Inspector.
Figure 2.14 also illustrates some important features of the Style inspector. Notice that :hover is selected in the menu. That shows the CSS style that is applied to that element when it is hovered over by the mouse. Also notice that the span:hover selector overrides the background-color setting in the span selector. The entire CSS hierarchy is displayed in the style window so you can see which property values are coming from what CSS selector and which values have been overridden.
Another extremely powerful tool when debugging CSS is the Layout inspector in the HTML Inspector. The Layout inspector, shown in Figure 2.15, provides an easy-to-use visual interface to the CSS layout of the selected HTML element.
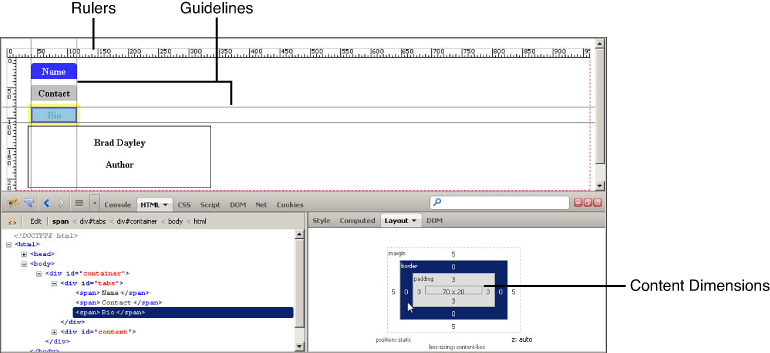
FIGURE 2.15 Viewing the CSS layout properties inside the Layout inspector inside the HTML Inspector.
From the Layout inspector you can use, view, and modify the following features:
Video 2.3—Try it Yourself: Editing the CSS Layout
LISTING 2.3 A Very Simple HTML Document with Some HTML Syntax Errors Illustrated in Figure 2.16
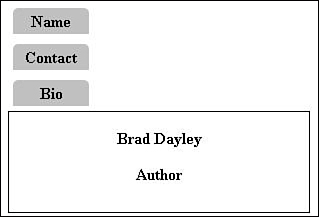
FIGURE 2.16 The poor CSS layout of the tabs makes the web page ugly.
1. Add the code in Listing 2.3 to a new file hour0203.html in the hour02 folder of your project and save the document
2. Open Firefox and click the Firebug icon to enable Firebug.
3. Open the following URL in Firefox:
http://localhost/code/hour02/hour0203.html
4. Click the HTML tab in Firebug and expand the <html>, then <body>, <div id="container">, and then <div id="tabs"> elements, as shown in Figure 2.17.
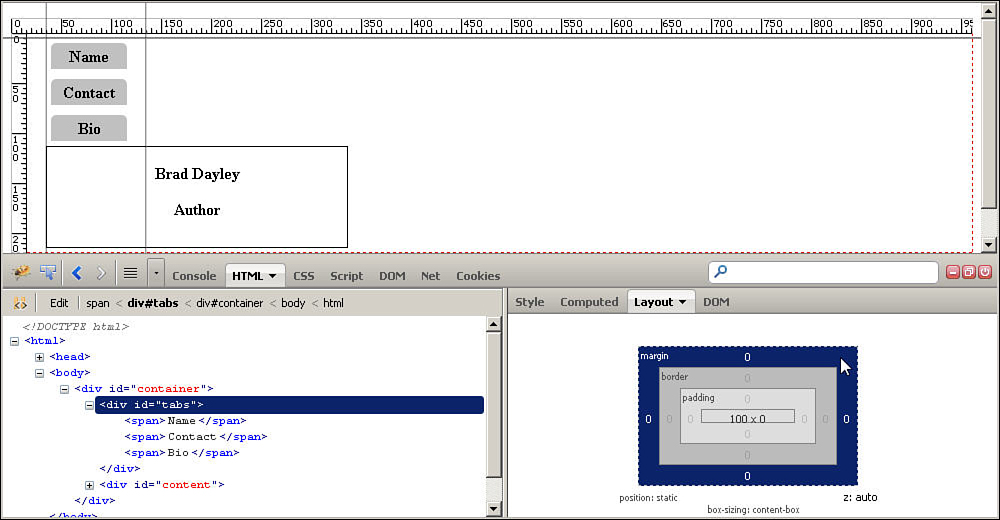
FIGURE 2.17 The Layout guidelines show that there is not enough room for three tabs side by side.
5. Select the <div id="container"> element and expand it.
6. Select the <div id="tabs"> child.
7. Select Layout and click the margin box. Look at the guidelines for the margin of the element that is supposed to contain the tabs. It is barely wider than one of the tabs, so it could not possibly support all three side by side.
8. To fix this problem, click the Style tab and change the width property to 300px, as shown in Figure 2.18. Notice that the tabs now are all side by side, but there is still too much space between them.
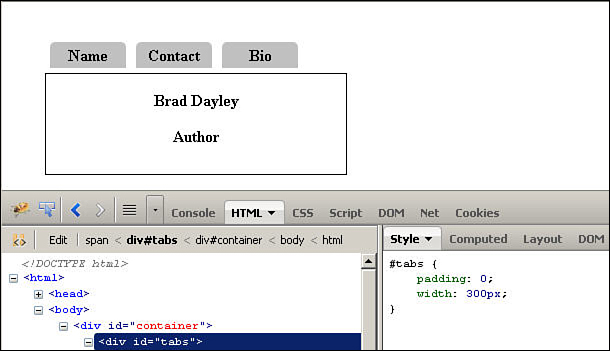
FIGURE 2.18 Changing the <div> width allows the tabs to be side by side, but they are still too far apart.
Note
You can also modify the margin, border, height, width, and padding values directly in the Layout View.
9. Right-click the Name tab in the web page and select Inspect Element with Firebug from the list. That element is automatically selected in the HTML Inspector.
10. Click the Layout tab and hover over the margin box, as shown in Figure 2.19. Notice that there is a margin of 5px around the <span> element. That is why they are not close to each other.
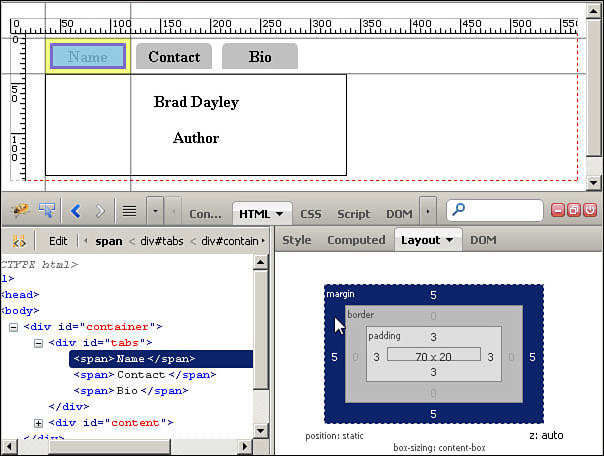
FIGURE 2.19 The Layout guidelines reveal that there is a margin around the <span> element keeping the tabs apart.
11. Go to the Style tab and disable the margin property for the <span> element, as shown in Figure 2.20. The tabs are now right together and sitting directly on top of the display box.
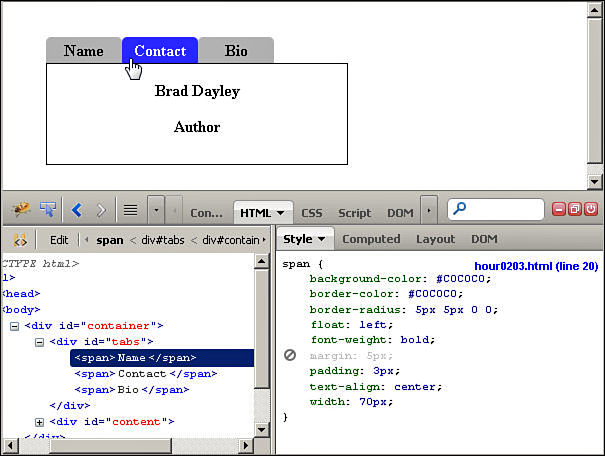
FIGURE 2.20 Disabling the margin allows the tabs to sit close to each other and the display box.
You already have learned to look for errors in JavaScript and other scripts in the JavaScript console. What if your script isn’t causing any browser errors, but it just isn’t working the way you want it to? Firebug has a very nice integrated debugger to help you out.
The JavaScript debugger allows you to view the JavaScript scripts that are loaded into the browser with the web page. In addition to viewing the scripts, you can set breakpoints, watch variable values, and view the call stack, just as you would with any other debugger.
Figure 2.21 shows the components of the JavaScript debugger available in Firebug. From the JavaScript debugger, you have access to the following features:
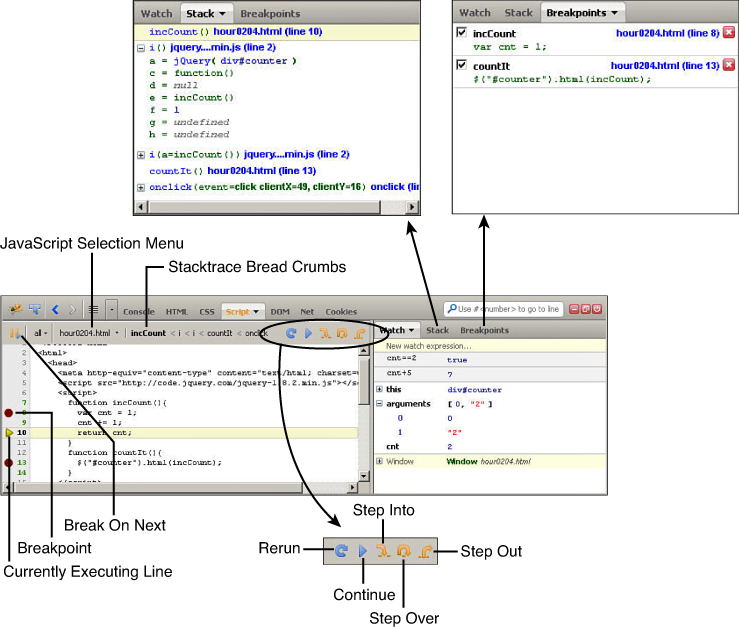
FIGURE 2.21 The Firebug debugger provides code, watch, stack, and breakpoint views.
Video 2.4—Try it Yourself: Using the JavaScript Debugger
LISTING 2.4 A Very Simple HTML Document with JavaScript Errors Illustrated
1. Add the code in Listing 2.4 to a new file hour0204.html in the hour02 folder of your project and save the document.
2. Open Firefox and click the Firebug icon to enable Firebug.
3. Open the following URL in Firefox. Notice the single button and the count value of 1.
http://localhost/code/hour02/hour0203.html
4. Click the Script tab in Firebug, and then select hour0204.html from the script selection menu. You should see the code from Listing 2.4 in the Script area of the debugger. Notice that the function that sets the value that is placed in the counter div is in lines 7–11.
5. Set a breakpoint on line 8 by clicking to the left of the line number. A red dot should appear, as shown in Figure 2.22. Also make sure the Watch tab is open in the debugger.
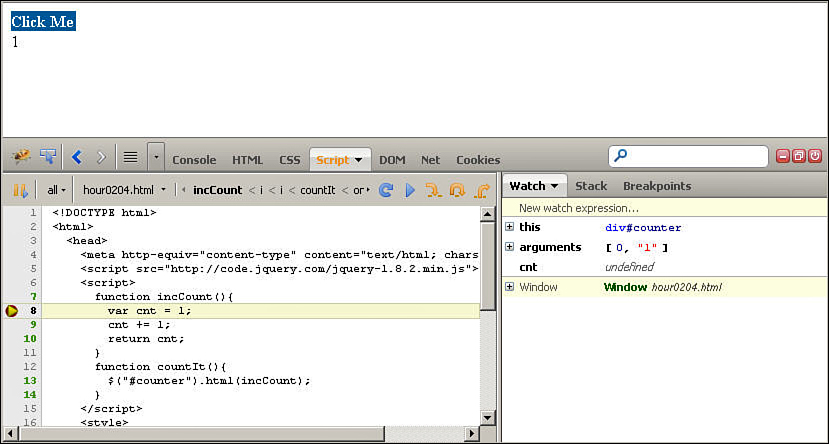
FIGURE 2.22 The JavaScript debugger in Firebug is stopped on line 8 because of a breakpoint. The Watch menu shows the value of the cnt variable as undefined.
6. Now click the button on the web page. You should see a yellow arrow appear and line 8 in the debugger highlighted. The script has stopped executing on that line. This function will determine what value will be placed in the counter. Notice that the value of the cnt variable in the Watch tab is undefined.
7. Click the Step Over icon. You should see the value of cnt go to 1.
8. Click the Step Over icon again. Now the value of cnt is 2, as expected, changed by the cnt += 1; line.
9. Click the Step Out icon three times to step out of this function and the jQuery functions in between. Notice that the value on the webpage has gone to 2.
10. Click the Continue button to allow the script to complete. So far, so good.
11. Click the button again in the web page. The debugger should activate again and be stopped in the same location as step 6. Notice that the value of cnt is undefined again.
12. Click the Step Over icon; cnt changes to 1. Click Step Over again and cnt changes to 2. As the button is clicked, cnt is reset to undefined, set to 1, and then incremented to 2.
13. To fix the problem, switch lines 7 and 8 in the original file in Aptana so that the definition of cnt happens before the definition of incCount(). This defines the variable cnt and sets the value only once when the script is loaded before the function is defined.
14. Save the file, then refresh the web page in Firefox. This time the script stops executing as the page is loading. Figure 2.23 shows the JavaScript debugger stopped on line 8 of hour0204.html. This occurred because the definition of the function is on line 8 instead of the definition of cnt.
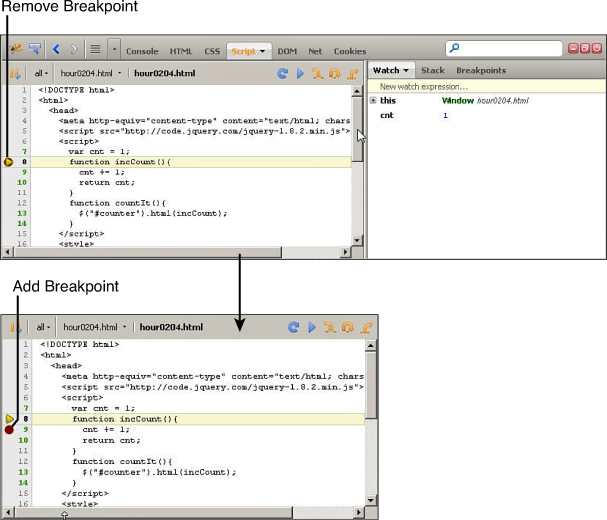
FIGURE 2.23 Changing the breakpoint from the function definition to the first line in the function.
15. Click the breakpoint on line 8 to remove it and add a breakpoint to line 9, as shown in Figure 2.23.
16. Click the Continue button to resume execution of the JavaScript and finish loading the web page.
17. Click the button in the web page, and the JavaScript should break again—this time on line 9. This time you will not see the cnt variable in the Watch window unless you expand the Window element, as shown in Figure 2.24.
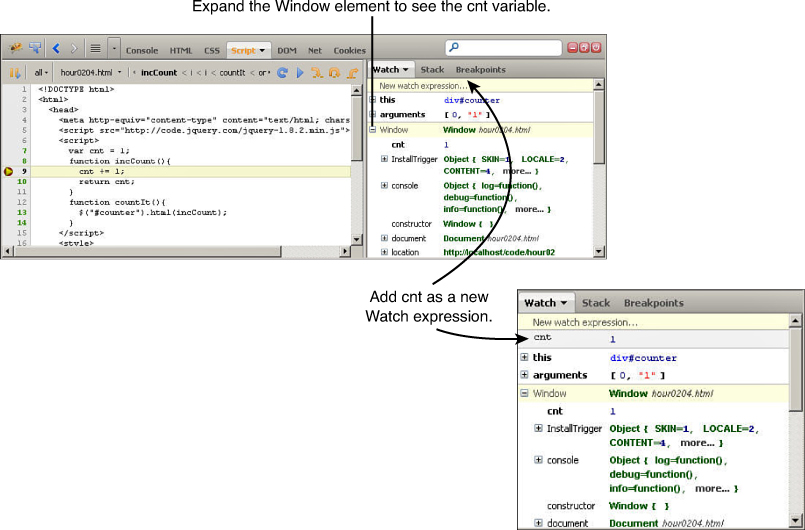
FIGURE 2.24 Adding a new Watch expression for cnt so you don’t have to expand the Window element each time.
18. Rather than having to expand the Window element each time you want to debug, click New Watch Expression at the top of the Watch list shown in Figure 2.24, type cnt, and press Enter. This adds a new watch expression right at the top for the cnt variable, as shown in Figure 2.24.
19. Click the Step Over icon and cnt will go to 2. Then click the Continue button to resume execution.
20. Click the button in the web page again, and this time the cnt variable will show as 2. When you click the Step Over button, the cnt variable will go to 3.
21. The program appears to be working, so click the breakpoint on line 9 to remove the breakpoint, and then click the Continue button to resume execution.
22. Now every time you click the button, the number is incremented. You’ve just debugged the JavaScript.
A question that comes up frequently, even with people that are experienced with debugging JavaScript, is how to debug jQuery. The answer is simple. jQuery and the numerous plug-ins and versions are just additional JavaScripts. To debug jQuery, download a non-minified version of the jQuery library from the Web and save it in your project. You learn how to do that later in this book.
The reason you download a non-minified version is that the minified is unreadable. Everything is crunched together in one line and doesn’t show up well in the debugger. The non-minified version is formatted in a readable form.
Note
Even if you cannot get a non-minified version of a JavaScript file, you can always open the file in Aptana and select File, Format from the main menu. Aptana will automatically format the file to a pretty, readable form. Most IDEs will have that type of feature.
With the jQuery or any other JavaScript library formatted, you can debug it like any other JavaScript file.
A very valuable tool available in Firebug that is often used in debugging JavaScript is the network traffic analyzer. The network traffic analyzer, shown in Figure 2.25, is available by clicking the Net tab in Firebug. The traffic analyzer displays information about each request from the browser to the web server. This allows you to get a better understanding about what data is being transferred and if requests are happening at all and in the right order.
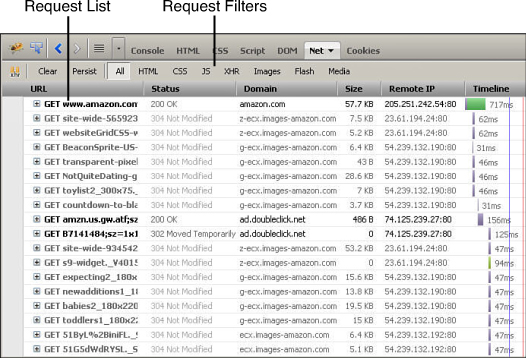
FIGURE 2.25 Network traffic required to load amazon.com.
Figure 2.25 shows the traffic involved in loading the amazon.com web page. There are numerous requests, each one represented by a single line in the traffic list. For each request, the following is shown in the traffic:
With some complex web pages, you may have too much traffic to try to debug all the requests. The filter options in the Net tab allow you to view only certain types of requests, such as HTML, CSS, or JS. The XHR filter stands for XMLHttpRequest, which is the communication used in AJAX. Selecting the XHR filter will show only AJAX communication.
When you expand a request, as shown in Figure 2.26, you get a lot of additional information about the request. What tabs are available in the expanded request depend on the request type and the response type, but here are some of the most useful items:
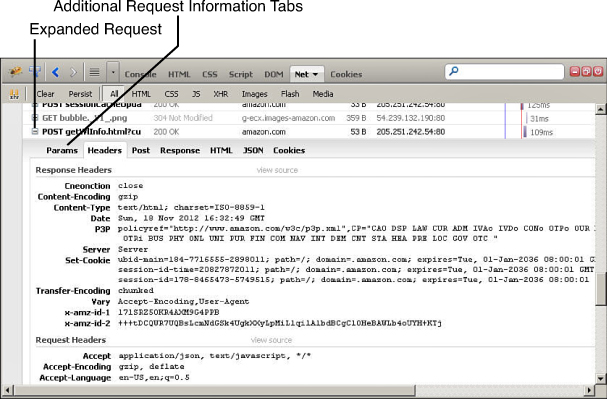
FIGURE 2.26 Expanding the request provides additional tabs with more information about the request and server response.
Note
If you click the down arrow on the Net tab in Firebug, there is an option to disable browser cache. This option can be very useful when you are updating files on the web server to debug and fix issues. When this option is checked, the browser will always retrieve the latest from the web server.
In this hour, you learned a myriad of ways to debug problems in your dynamic web pages. You learned how to output messages from your scripts to the JavaScript console. You learned how to use the HTML Inspector to see the HTML elements that the browser has built while loading the web page.
You also followed several examples of debugging problems in HTML, CSS, and JavaScript. The methods you learned throughout this hour will be very helpful to you as you finish this book and in future projects because they will save a lot of time and frustration with simple syntax problems that always seem to creep up.
Q. Is there a way to debug server-side scripts?
A. Yes, there is. It is really beyond the scope of this book; however, most good languages have a method of remotely debugging problems. If you are trying to debug PHP server-side scripts, look into the capabilities of ZEND at www.zend.com/en/community/pdt. If you are working with Python server-side scripts, check into using PyDev at pydev.org.
Q. Is there a way to debug cookies?
A. As far as debugging cookies, all you need to really know is whether cookies are enabled, which cookies are set in the browser, what the cookie values are, and when they expire. All of that information can be found in the Cookies tab in Firebug. There are similar features with both Chrome and Internet Explorer in their developer consoles.
1. Modify the hour0204.html code to output the value of cnt to the JavaScript console by adding the following code at line 10.
console.log("cnt=%d",cnt);
2. Use the Net traffic as you browse the traffic from some different pages. Expand some of the requests and look at the data represented in some of the tabs. This can help you understand the ebb and flow of browser to web server traffic a bit better.